Visualization
The visualization module provides a variety of functions to visualize initial, intermediate and final datasets within trackintel.
plot
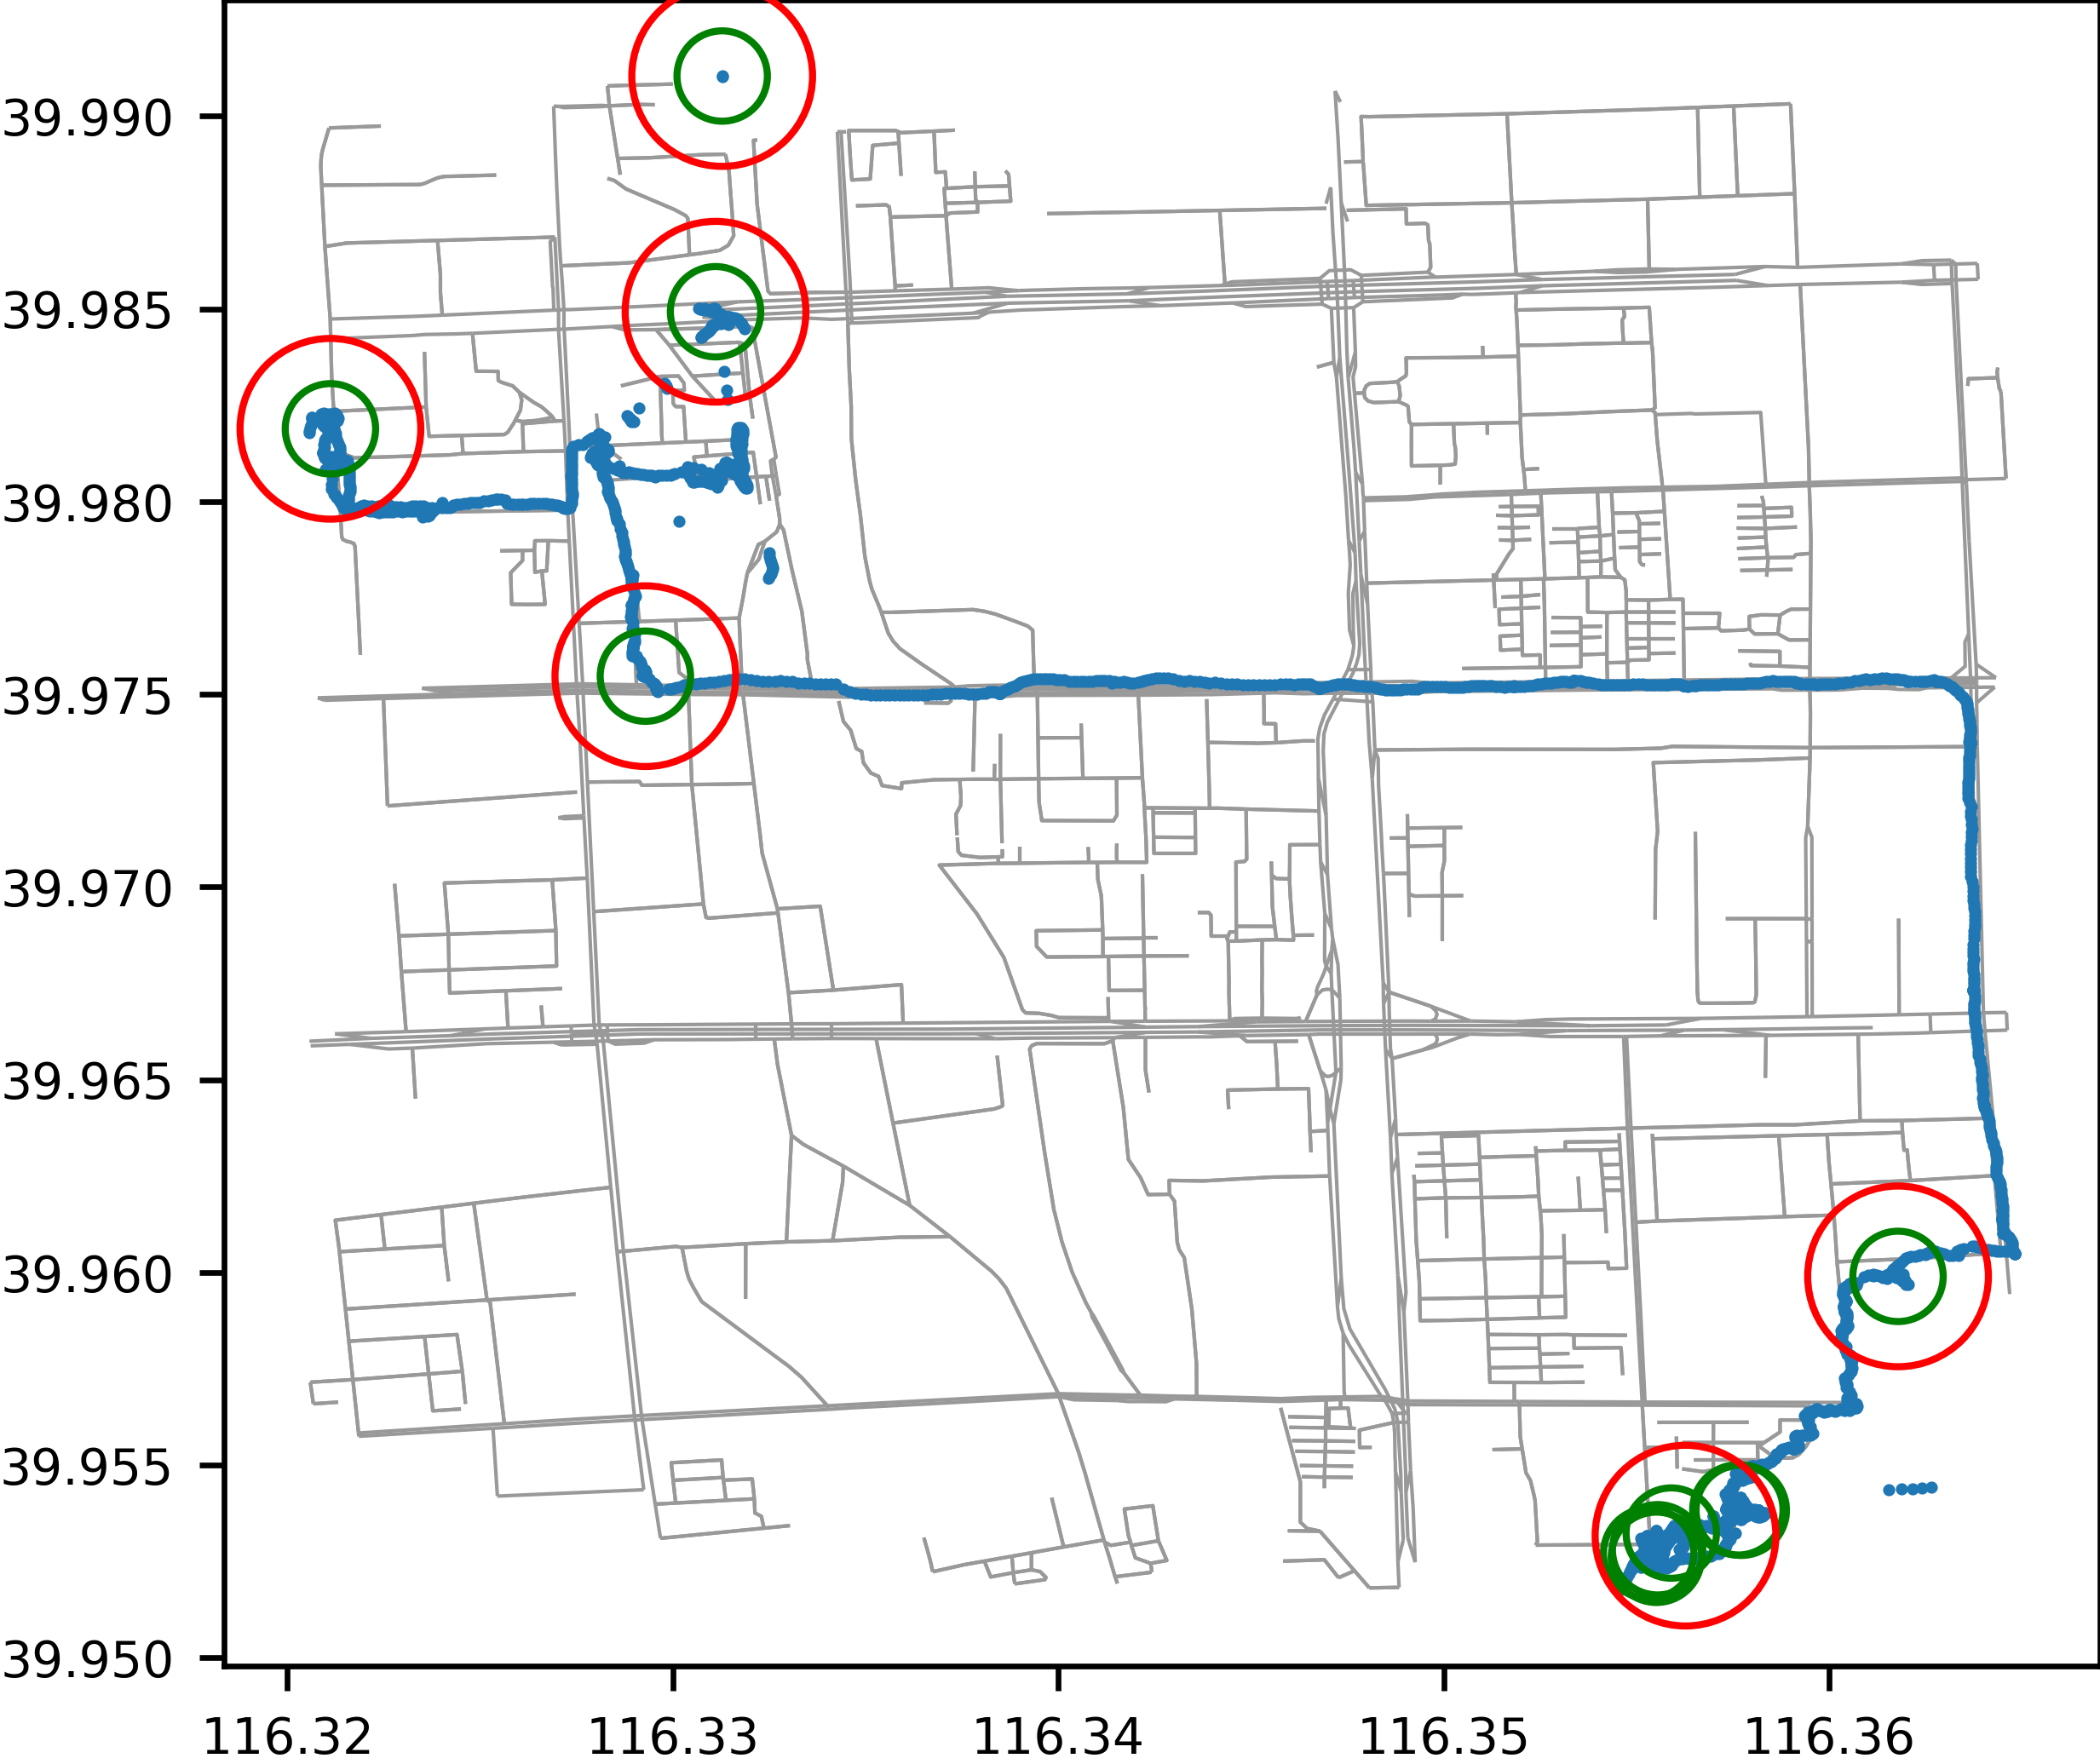
- trackintel.plot(positionfixes=None, staypoints=None, triplegs=None, locations=None, radius_sp=100, radius_locs=150, filename=None, plot_osm=False, ax=None)[source]
Plots positionfixes, staypoints, locations on a map (optionally to a file)
One of the arguments [positionfixes, staypoints, triplegs, locations] should not be None!
- Parameters:
positionfixes (Positionfixes, optional) – Positionfixes to plot, by default None
staypoints (Staypoints, optional) – Staypoints to plot, by default None
triplegs (Triplegs, optional) – Triplegs to plot, by default None
locations (Locations, optional) – Locations to plot, by default None
radius_sp (float, optional) – Radius in meter for circles around staypoints, default 100
radius_locs (float, optional) – Radius in meter for circles around locations, default 150
filename (str, optional) – The file to plot to, else if ax is none plot will be shown, by default None
plot_osm (bool, optional) – If True, will download OSM street network and plot it as base map, by default False If True depending on the extent of your data, this might take a long time!
ax (matplotlib.pyplot.Artist, optional) – axis on which to draw the plot, by default None
Examples
>>> ti.plot(positionfixes=pfs, filename="output.png", plot_osm=True)
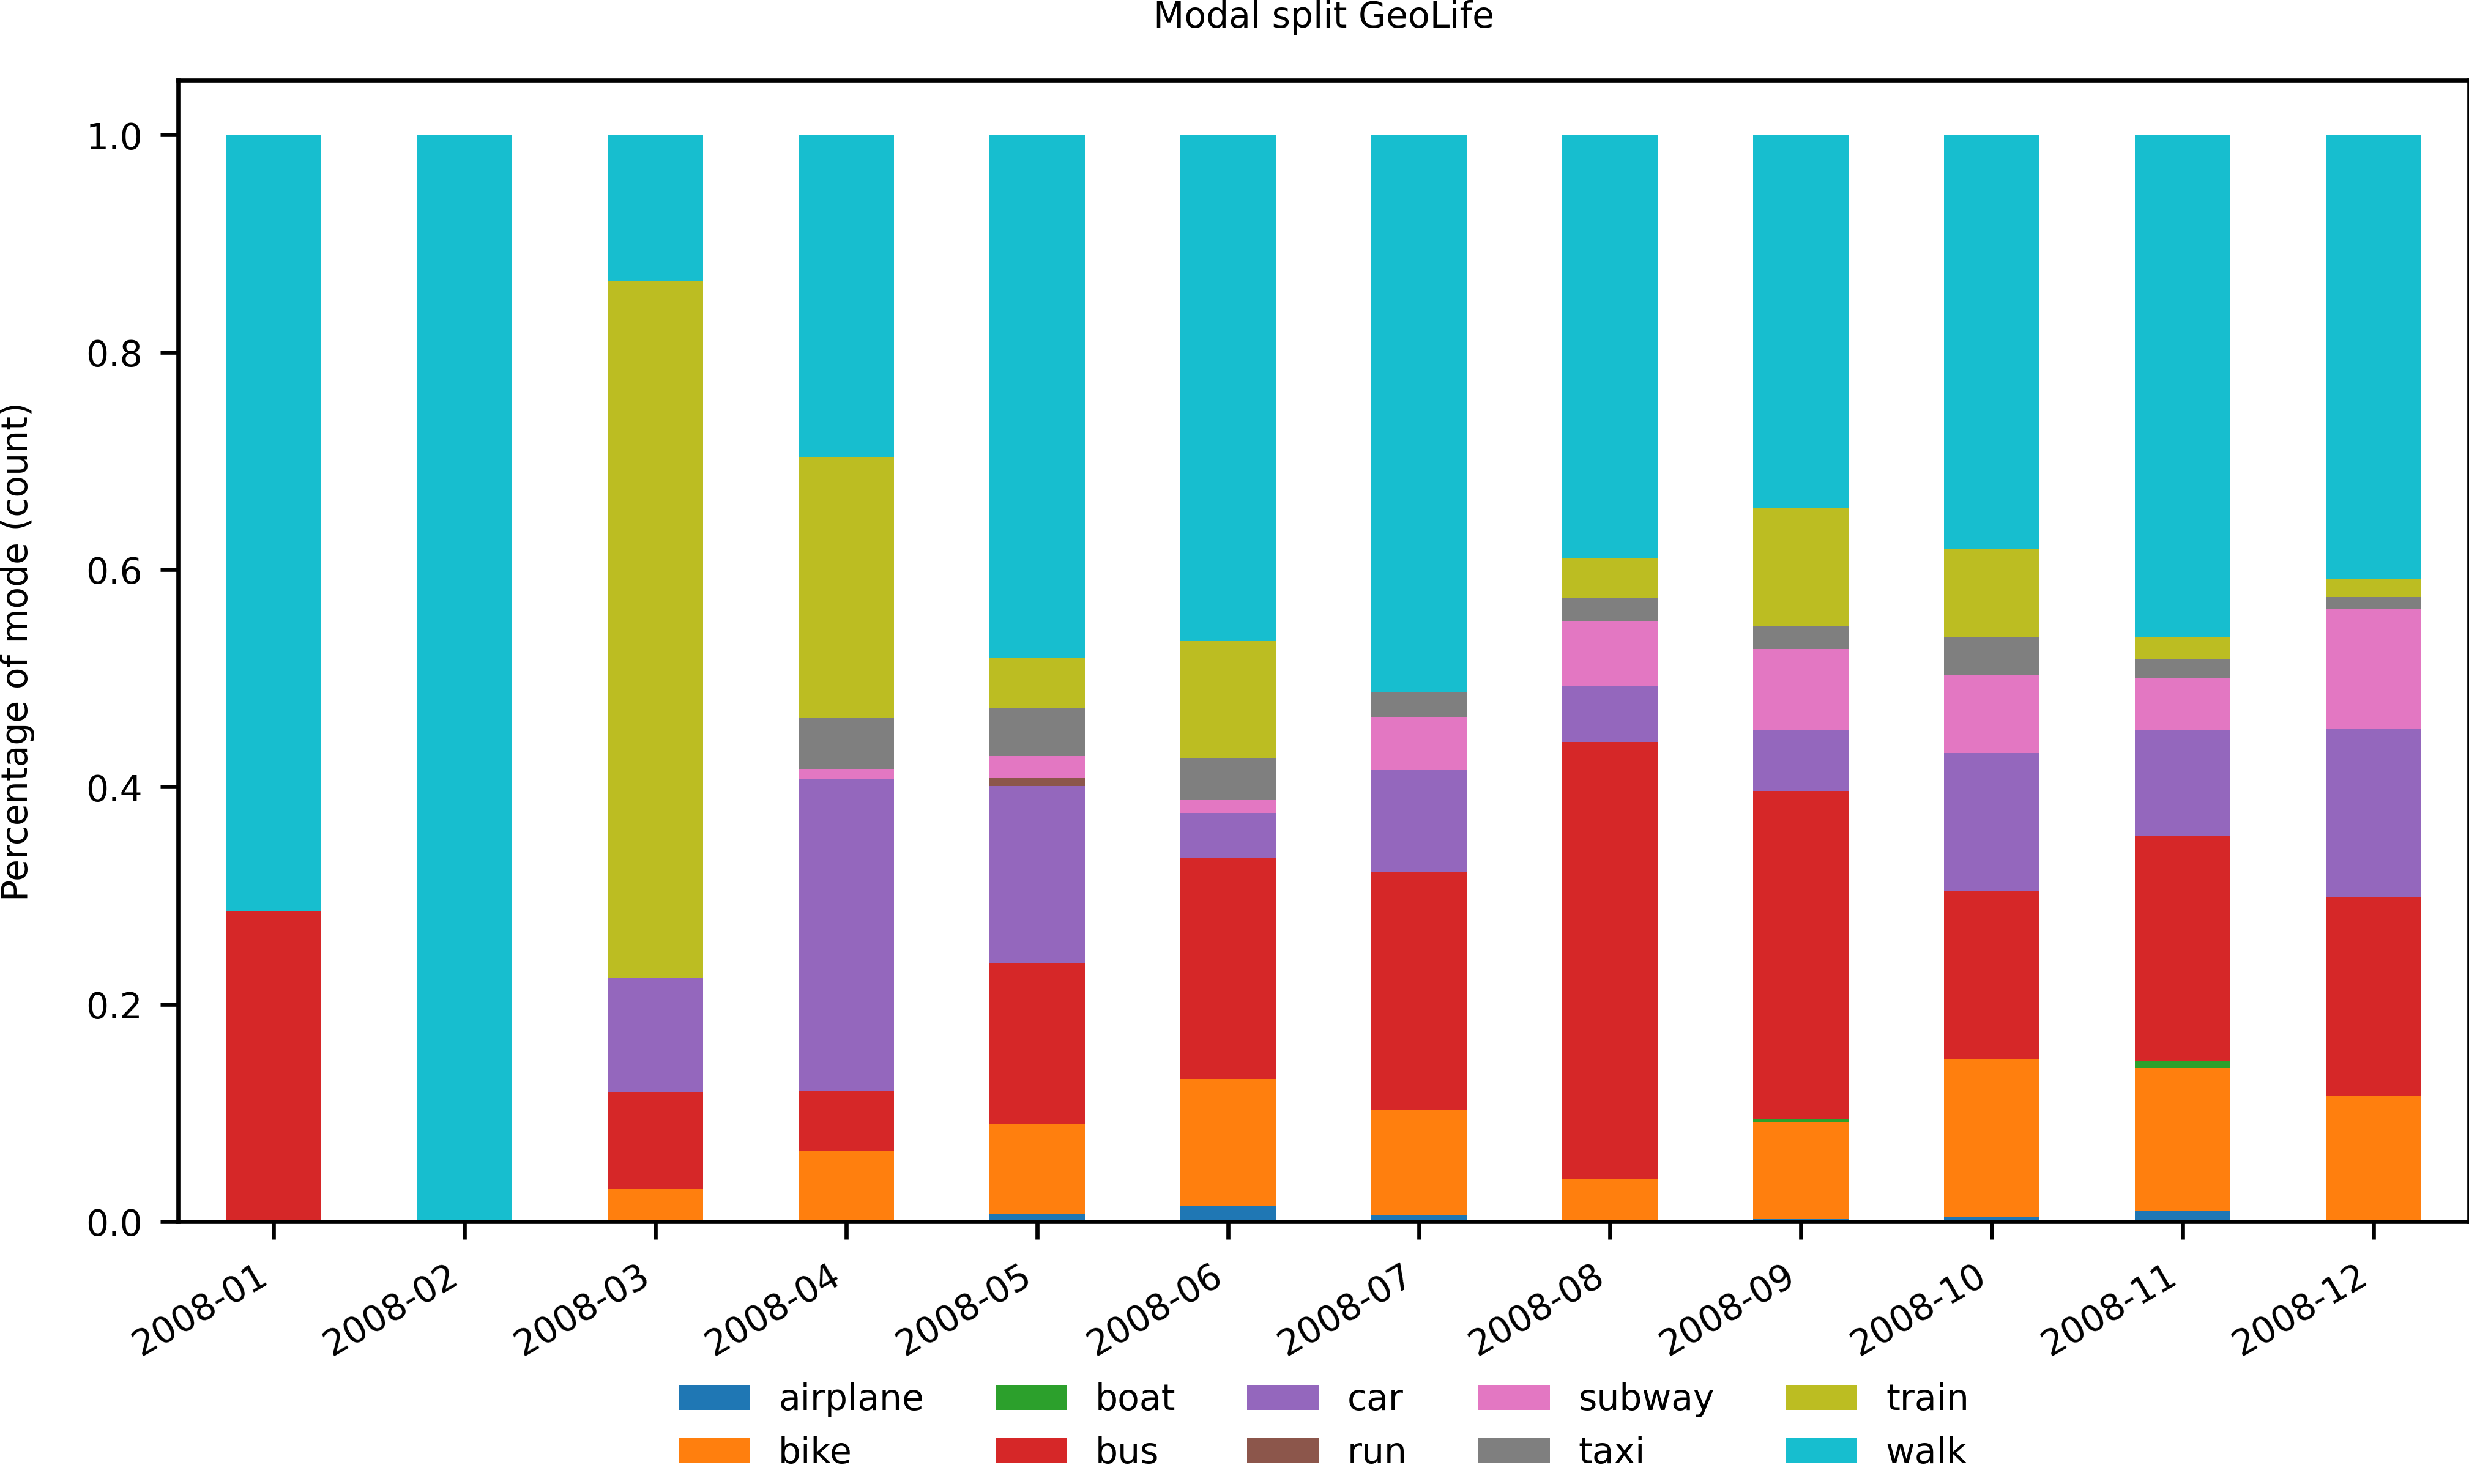
Modal split
- trackintel.plot_modal_split(df_modal_split_in, out_path=None, date_fmt_x_axis='%W', fig=None, axis=None, title=None, x_label=None, y_label=None, x_pad=10, y_pad=10, title_pad=1.02, skip_xticks=0, n_col_legend=5, borderaxespad=0.5, bar_kws=None)[source]
Plot modal split as returned by trackintel.analysis.calculate_modal_split
- Parameters:
df_modal_split (DataFrame) – DataFrame with modal split information. Format is
out_path (str, optional) – Path to store the figure
date_fmt_x_axis (str, default: '%W') – strftime() date format code that is used for the x-axis
title (str, optional)
x_label (str, optional)
y_label (str, optional)
fig (matplotlib.figure) – Only used if axis is provided as well.
axis (matplotlib axes)
x_pad (float, default: 10) – Used to set ax.xaxis.labelpad
y_pad (float, default: 10) – Used to set ax.yaxis.labelpad
title_pad (float, default: 1.02) – Passed on to matplotlib.pyplot.title
skip_xticks (int, default: 1) – Every nth x-tick label is kept.
n_col_legend (int) – Passed on as ncol to matplotlib.pyplot.legend()
borderaxespad (float) – The pad between the axes and legend border, in font-size units. Passed on to matplotlib.pyplot.legend()
bar_kws (dict) – Parameters that control the bar-plot visualization, passed to DataFrame.plot.bar()
- Returns:
fig (Matplotlib figure handle)
ax (Matplotlib axis handle)
Examples
>>> modal_split = calculate_modal_split(triplegs, metric='count', freq='D', per_user=False)
>>> plot_modal_split(modal_split, out_path=tmp_file, date_fmt_x_axis='%d',
>>>                  y_label='Percentage of daily count', x_label='days')